

Covid infection rates continue falling
Herald Reporter
The last 30 days, from round about the start of the present surge in infections on November 27 to Sunday, saw more than 70 000 new cases and 188 deaths, with 104 of those deaths, more than a half, in the previous seven days.
The infection rate, measured by the number of new daily cases, rocketed far faster than the previous three surges of infection, one of the signs that the Omicron variant with its high level of infectiousness, was fuelling the outbreak.
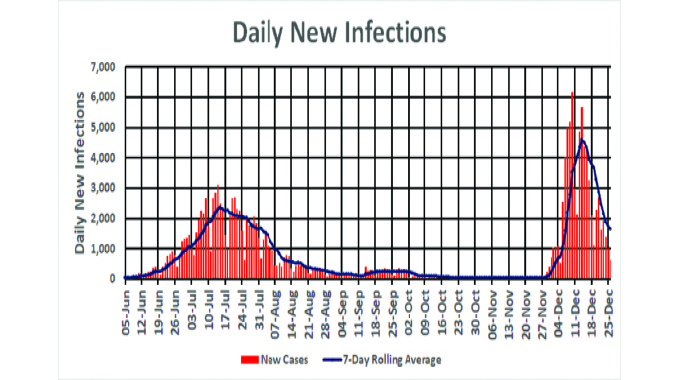
In less than two weeks, the number of daily new cases had climbed to a record 6 181 on Friday December 10, with the seven-day rolling average, which measures trends, reaching its peak of 4 580 four days later on December 14.
The only good point is that the rapid rise was followed by an equally rapid fall, with daily infections dropping below 1 000 to 605 on Sunday, although the rolling average probably gives a better indication of true progress at 1 651.
The number of confirmed daily cases tends to fall at weekends as people postpone for a day or two to the next working day their confirmation test, with these then congregating around the first couple of working days each week.
The death rate is mirroring the infection rate, but a couple of weeks later since it usually takes one to three weeks for a particular person’s infection to reach critical symptoms if that case is to develop major complications.
While daily deaths did fall to six on Sunday, the continuously rising rolling average crept up marginally to 14,9.

With 70 515 new cases in the last 30 days, but 37 249 active cases on Sunday, it seems that almost a half those who were infected with Covid-19 in the last month have recovered and been allowed to return to work and resume a normal life.
The recovery rate, that this the percent of patients who have recovered since the start of Covid-19 in Zimbabwe last year, has crawled up to 79 percent.
Another 4 891 of the recorded deaths in the 204 351 cases have died, that is around 2,39 percent leaving almost 19 percent still on the sick list, a total that shows the vehemence of the present spurt.
Vaccinations are just creeping along with last weeks 97 103 jabs being the lowest weekly total since the first week of July, when inflows of vaccines allowed dramatic acceleration of the programme.
The festive season is probably responsible for many postponing their shots until they return to work, but it is delaying mass protection that only comes with exceptionally high vaccination rates.
By Sunday 4 103 012 Zimbabweans had received their first shot with 3 111 359, or a little over three-quarters, having gone back for their second. But this is just 27,35 percent of the total population of around 15 million who have entered the programme with at least one shot and 20,74 with both.
Once we look at the 9 387 735 Zimbabweans the Ministry of Health and Child Care estimates are aged 16 and over, the percentages improve, with 43,7 of this group now having had the first shot and 33,1 percent the second.
The ministry’s target is all 9,38 million, as this is only around 62,6 percent of the entire population, very close to the minimum percentage originally estimated as being needed for herd immunity.
So we have a long way to go being only about a third of the way to that point.
Vaccination does work. Bulawayo’s infection and death rates were running higher than Harare’s in the third wave, when vaccination levels were still low.
Since then Bulawayo has taken a clear lead in the 10 provinces with 50,5 percent of the target age groups now having had both shots.
This saw its infection and death rates running at just over half of Harare province once population levels are adjusted for, since Harare-Chitungwiza has just around 30 percent of the targeted age groups fully vaccinated.
Even though the infection rates are falling significantly, so severe was the present wave, in numbers at least, that the daily totals are still showing the sort of numbers seen around the peak of the third wave, as a glance of the comparison graph shows.


You Might Also Like
-
The major effort to stock dams and fish ponds to bring fish farming and fisheries to the majority of rural households has started, and it appears it will be a major effort with probably tens of millions of fingerlings needed to create the required populations. That in turn will create a whole new industry with […]


Agriculture Journal

Comments